Forbearance on debt repayment was a key provision of the CARES Act, legislation intended to combat the widespread economic losses stemming from the COVID-19 pandemic. This pause on required payments for federally guaranteed mortgages and student loans has provided temporary relief to those affected by the COVID-19 pandemic, and servicers of nonfederal loans often provided forbearances or other relief on request as well. Here, using a special survey section fielded with the August 2020 Survey of Consumer Expectations, we aim to understand who benefitted from these provisions. Specifically, were there differences by age, race, income, and educational background? Did individuals who suffered job or income losses benefit differentially? Did renters receive more or less nonhousing debt relief than homeowners? Answers to these questions are not only key for understanding the economic recovery and implications for inequality and equitable growth, they can provide important insight into the expected effects of more recent and potential future legislation.
Background and Data
The CARES Act and its subsequent extensions established a foreclosure moratorium and made borrowers with FHA-, VA- and GSE-backed mortgages with COVID-19 related hardship eligible for a 180-day forbearance period with possible extension to 360 days. Other lenders were also encouraged to work with their borrowers to avoid defaults. In February 2021, moratorium on foreclosures was extended till end of June 2021 and forbearance relief too was further expanded. Specifically, the forbearance enrollment window was extended until June 30, 2021, and homeowners who entered initial forbearance by June 2020 became eligible for an additional six months of forbearance. For renters, the eviction moratorium mandated by the Center for Disease Control and Prevention (CDC) was extended until the end of July 2021.
Under the CARES Act, federal student debt could be deferred until September 30, 2020. This deferral was later extended to January 31, and more recently to the end of September 2021. Moreover, interest on student debt is waived during the forbearance period.
In this post, we leverage data from the August 2020 wave of the Survey of Consumer Expectations (SCE). Since June 2013, this monthly survey has collected information on the economic expectations, choices, and behavior of household heads. The SCE covers about 1,300 nationally representative U.S. households and, in addition to monthly core questions, special modules focusing on specific topics are fielded frequently. As a part of the June and August special modules, we asked respondents about debt repayment, difficulties/successes in obtaining relief, the type of relief received, the reasons for obtaining relief, and their near and medium term expectations.
An earlier two-part Liberty Street Economics (LSE) series leveraging the New York Fed’s Consumer Credit Panel—consisting of detailed Equifax credit report data for an anonymized, nationally representative sample of individuals and households—looked at who could expect to benefit the most from CARES Act debt relief and which borrowers would continue to feel the most strain. This analysis found that mortgage relief was more likely to be concentrated in high income and majority white neighborhoods. In contrast, they found that borrowers who do not have a mortgage or student debt – those that would not benefit from the loan forbearance provisions of the CARES Act – were more concentrated in lower income and majority Hispanic or Black neighborhoods.
A more recent four-part LSE series, using data from the New York Fed’s Consumer Credit Panel, focused on different aspects of mortgage forbearance. The series found that forbearance rates were markedly higher for delinquent borrowers, forborne borrowers saw a sharp decline in delinquencies and credit card balances, and nearly two-thirds of forborne borrowers left forbearance, although lower income and lower credit score borrowers were more likely to linger in forbearance.
In this post, we take an important step forward: the individual-level SCE data enable us to examine who obtained mortgage and student loan forbearances as well as other forms of debt relief, whether the likelihood of getting relief varied with respect to an individual’s socioeconomic characteristics and how they were personally affected by the pandemic. Apart from the above four-part series, other recent analysis has also suggested that forbearance relief has succeeded in stemming a massive increase in delinquencies; here we investigate who the recipients of this forbearance relief were.
Who Received Forbearance Relief?
In the August 2020 SCE, we asked borrowers if they were able to obtain any kind of debt relief, such as a deferment or a reduction of payment or a decline in fees or interest rates. We find that 9.8 percent of renters reported receiving some rental relief (such as deferment, forgiveness, or reduction) while 5.5 percent of households with a mortgage reported receiving relief from their mortgage servicer. For auto loans, we find a higher rate (13.6 percent) of borrowers reporting receiving some assistance from their auto loan/lease servicer. Among credit card users, 11.0 percent reported receiving some assistance from their credit card company (including fee and interest rate reductions and credit card limit increases). Thus, higher shares of auto debt and credit card borrowers reported seeking and receiving some relief compared to mortgagors and renters. As federal direct student loan borrowers were all automatically placed in administrative forbearance, we will focus our attention in this post primarily on debts other than student loans.
In the June 2020 survey, we also asked respondents who requested relief or were planning to do so their reasons for making such a decision. The most prominent response (59 percent) was a “decline in household income,” followed by respondents who reported a desire (39 percent) to shore up their “rainy day funds.” Turning to those who decided not to seek payment relief, we find that by far the most prominent reason cited was that these households were still able to afford payments (95 percent).
Next, we use data from the August 2020 survey to zoom in on the distribution of each kind of relief. For example, were there differences in relief receipt by demographic characteristics (race, age, income, education)? Does receipt vary by how individuals were affected in the labor market?
First, we focus on rent relief. While mortgage forbearances were a part of the CARES Act, rent relief was often offered by landlords on a voluntary basis, although landlords benefiting from mortgage relief were required to provide rent relief to their renters. Focusing on the sample of renters and breaking down rental relief receipt by race, we find in the chart below that similar shares of white and nonwhite renters obtained relief (7.9 percent versus 7.7 percent). We find that the incidence of rental relief was higher among college-educated renters—12.4 percent of college-educated renters received some type of rental assistance while 8.4 percent of noncollege renters did so. Differentiating by income, we find that low income renters were more likely to have received payment relief or assistance than their higher income counterparts. While these patterns for education and income groups seem to conflict with one another, there are several potential reasons behind the apparent divergence. Individuals with higher levels of education tend to be better informed and may be more willing to put in the effort needed to complete the necessary documentation for rent relief. Also, more educated individuals are more likely to own their residences; those who rent may have lower incomes relative to people with similar levels of education. On the other hand, low income individuals may have had more difficulty paying rent and opted to apply for rent relief. Additionally, we differentiate between renters who faced an income loss during the pandemic with those that did not and find that those who sustained income losses were more likely to have received rental relief (12.7 percent versus 8.6 percent). These numbers imply that rent payment relief disproportionately benefited those who lost income or jobs.
Renters Facing Income Loss Were Disproportionately More Likely to Receive Rent Relief
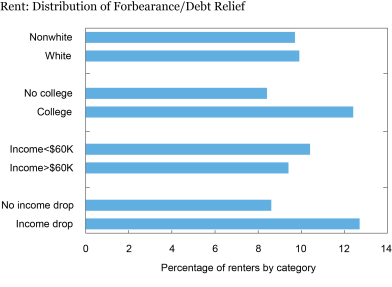
Source: New York Survey of Consumer Expectations, August 2020 Survey.
Next, we turn to the distribution of mortgage payment relief. In the chart below, which considers respondents with a mortgage, we find that nonwhite mortgagors were more likely to receive mortgage relief than white mortgagors (11.1 percent of nonwhite mortgagors received relief versus 4.7 percent of white mortgagors). Additionally, we find that mortgagors who were not college educated were more likely to receive mortgage relief (6.1 percent versus 4.9 percent) and high income mortgagors were more likely to benefit from mortgage relief (5.8 percent versus 2 percent). Differentiating between mortgagors who experienced a drop in income during the pandemic versus those that did not, we find that those that lost income were more likely to benefit from forbearance relief (8.1 percent versus 3.4 percent). This implies that mortgagors who faced higher financial hardship benefited disproportionately more from mortgage relief, similar to the picture above for rental relief. This also matches an earlier finding that borrowers who had higher repayment difficulties benefited more from mortgage forbearance relief.
High Income Mortgagors Were Considerably More Likely to Benefit from Mortgage Forbearance Relief
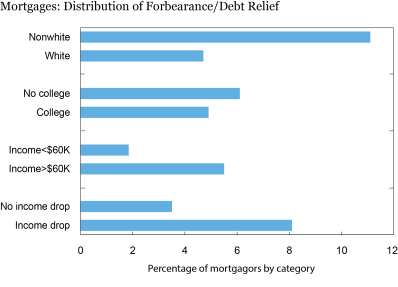
Source: New York Survey of Consumer Expectations, August 2020 Survey.
Next, we turn our attention to credit card debt and auto debt forbearance relief. Credit card debt and auto debt relief were offered by lenders on a voluntary basis. The chart below looks at the distribution of credit card debt relief among credit card debtors. We find that nonwhite credit card holders were more likely to receive credit card debt relief than white credit card holders—19.7 percent of nonwhite credit card holders reported receiving some credit card debt assistance compared to 9.7 percent of white credit card holders. Looking at heterogeneity by education, we find that a slightly lower percentage of college educated credit card holders received credit card debt relief than those that did not have college education. Differentiating by labor market outcomes, we find that credit card holders who faced an income loss during the pandemic were markedly more likely to receive relief (14.8 percent versus 8.9 percent). Additionally, we find that credit card holders who were renters were more likely to receive relief than homeowners (13.1 percent versus 10 percent).
Nonwhite, Low-Income, and Renter Credit Card Holders Were Substantially More Likely to Receive Credit Card Debt Relief
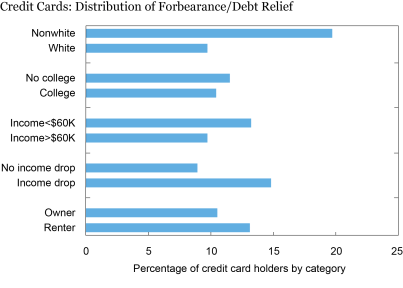
Source: New York Survey of Consumer Expectations, August 2020 Survey.
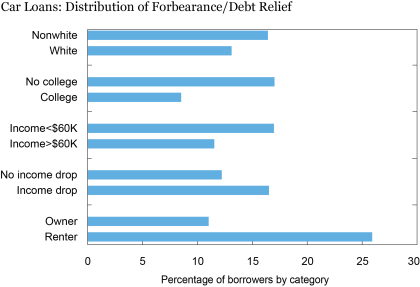
Finally, we turn to auto loan debt holders. The chart below shows the distribution of auto debt payment relief among auto debt holders. We find that nonwhite, low income, and less educated auto loan debtors were more likely to have received auto debt relief compared, respectively, to white, higher income, and more highly educated auto loan debtors, a finding that mimics our findings for credit card debt relief. As with credit card debt relief, we additionally find that auto debt holders who are renters were markedly more likely to receive relief, as were auto debt holders who experienced a decline in income during the pandemic.
Nonwhite, Low-Income, and Renter Auto Debt Holders Markedly More Likely to Receive Auto Debt Relief
Source: New York Survey of Consumer Expectations, August 2020 Survey.
Discussion and Conclusion
In this post, we investigated whether forbearance relief was equally distributed across the population. We uncover marked differences in the distribution of forbearance across demographic groupings and across individuals who experienced different labor market outcomes. Consistent with our earlier expectations, we find that mortgage debt relief was disproportionately received by high income households. The picture is different in the rental, credit card, and auto debt markets, where low income renters/debtors reported a higher incidence of the corresponding relief. Differentiating by race and education, we find that nonwhite and less educated households with a certain kind of debt (mortgage, credit card, auto) were more likely to receive relief on payments for that kind of debt. This contrasts with our findings in the rental market, where white and more educated renters reported a comparable or higher probability of rental assistance.
Across all markets, households that lost income and thus faced financial hardship were more likely to receive forbearance relief than other households. The distributions of forbearance relief receipt by income, education, and race are more uneven across markets. The above analysis provides insights into how the recent extension of relief can affect different populations and can serve as guides to policy. It remains to be seen how the different groups will fare when these relief measures expire at the end of summer/early fall. We will continue to closely monitor the situations of consumers in various markets as economic and policy conditions evolve.

Rajashri Chakrabarti is a senior economist in the Federal Reserve Bank of New York’s Research and Statistics Group.
Jessica Lu is a senior research analyst in the Bank’s Research and Statistics Group.

Joelle Scally is a senior data strategist in the Bank’s Research and Statistics Group.

How to cite this post:
Rajashri Chakrabarti, Jessica Lu, Joelle Scally, and Wilbert van der Klaauw, “Who Received Forbearance Relief?,” Federal Reserve Bank of New York Liberty Street Economics, August 2, 2021, https://ift.tt/3CasiiO.
Related Reading
Keeping Borrowers Current in a Pandemic (May 2021)
What Happens during Mortgage Forbearance? (May 2021)
Debt Relief and the CARES Act: Which Borrowers Benefit the Most? (August 2020)
Disclaimer
The views expressed in this post are those of the authors and do not necessarily reflect the position of the Federal Reserve Bank of New York or the Federal Reserve System. Any errors or omissions are the responsibility of the authors.
Who Received Forbearance Relief? – Liberty Street Economics - Federal Reserve Bank of New York
Read More


No comments:
Post a Comment